IPython Notebook is a very powerful interactive computational environment, and with Apache PredictionIO, PySpark and Spark SQL, you can easily analyze your collected events when you are developing or tuning your engine.
Prerequisites
Before you begin, please make sure you have the latest stable IPython installed, and that the command ipython can be accessed from your shell's search path.
Export Events to Apache Parquet
PredictionIO supports exporting your events to Apache Parquet, a columnar storage format that allows you to query quickly.
Let's export the data we imported in Recommendation Engine Template Quick Start, and assume the App ID is 1.
1 | $ $PIO_HOME/bin/pio export --appid 1 --output /tmp/movies --format parquet |
After the command has finished successfully, you should see something similar to the following.
1 2 3 4 5 6 7 8 9 10 11 | root |-- creationTime: string (nullable = true) |-- entityId: string (nullable = true) |-- entityType: string (nullable = true) |-- event: string (nullable = true) |-- eventId: string (nullable = true) |-- eventTime: string (nullable = true) |-- properties: struct (nullable = true) | |-- rating: double (nullable = true) |-- targetEntityId: string (nullable = true) |-- targetEntityType: string (nullable = true) |
Preparing IPython Notebook
Launch IPython Notebook with PySpark using the following command, with $SPARK_HOME replaced by the location of Apache Spark.
1 | $ PYSPARK_DRIVER_PYTHON=ipython PYSPARK_DRIVER_PYTHON_OPTS="notebook --pylab inline" $SPARK_HOME/bin/pyspark |
If you see a error appearing in the console like this:
1 2 | [E 10:07:53.900 NotebookApp] Support for specifying --pylab on the command line has been removed. [E 10:07:53.901 NotebookApp] Please use `%pylab inline` or `%matplotlib inline` in the notebook itself. |
Then you can use the following command.
1 | PYSPARK_DRIVER_PYTHON=ipython PYSPARK_DRIVER_PYTHON_OPTS="notebook --`%pylab inline`" $SPARK_HOME/bin/pyspark |
By default, you should be able to access your IPython Notebook via web browser at http://localhost:8888.
Let's initialize our notebook for the following code in the first cell.
1 2 3 4 5 6 7 | import pandas as pd def rows_to_df(rows): return pd.DataFrame(map(lambda e: e.asDict(), rows)) from pyspark.sql import SQLContext sqlc = SQLContext(sc) rdd = sqlc.parquetFile("/tmp/movies") rdd.registerTempTable("events") |
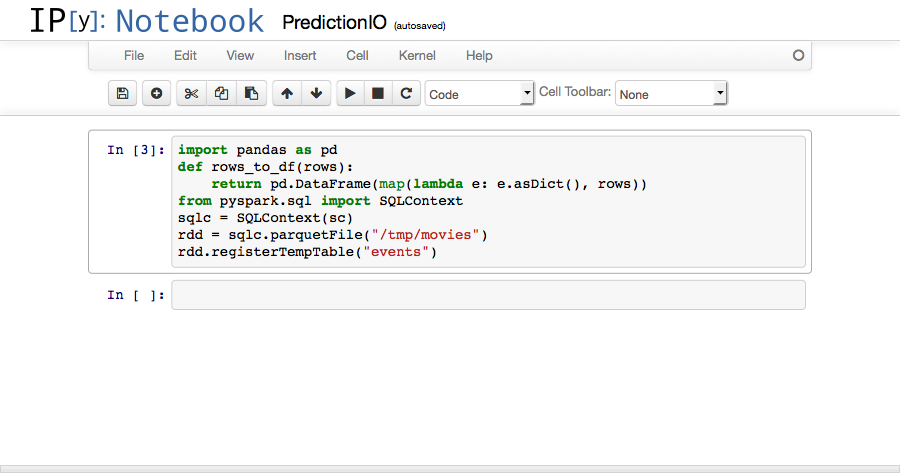
rows_to_df(rows) will come in handy when we want to dump the results from Spark SQL using IPython Notebook's native table rendering.
Performing Analysis with Spark SQL
If all steps above ran successfully, you should have a ready-to-use analytics environment by now. Let's try a few examples to see if everything is functional.
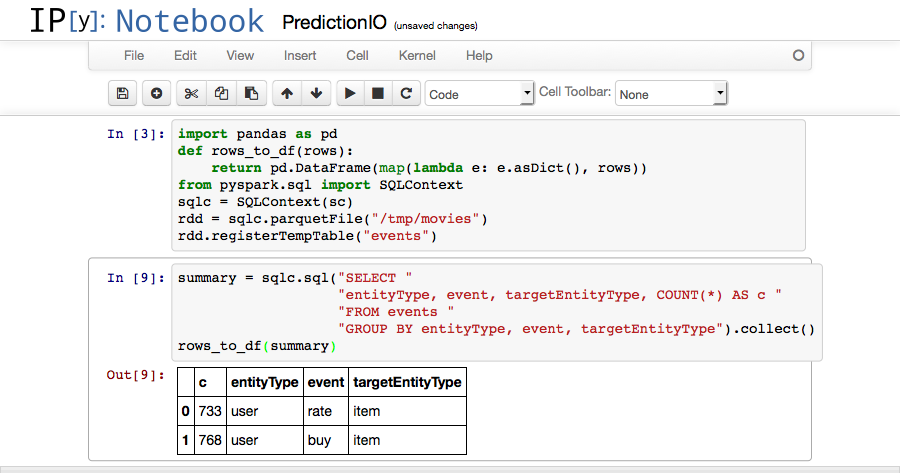
In the second cell, put in this piece of code and run it.
1 2 3 4 5 | summary = sqlc.sql("SELECT " "entityType, event, targetEntityType, COUNT(*) AS c " "FROM events " "GROUP BY entityType, event, targetEntityType").collect() rows_to_df(summary) |
You should see the following screen.
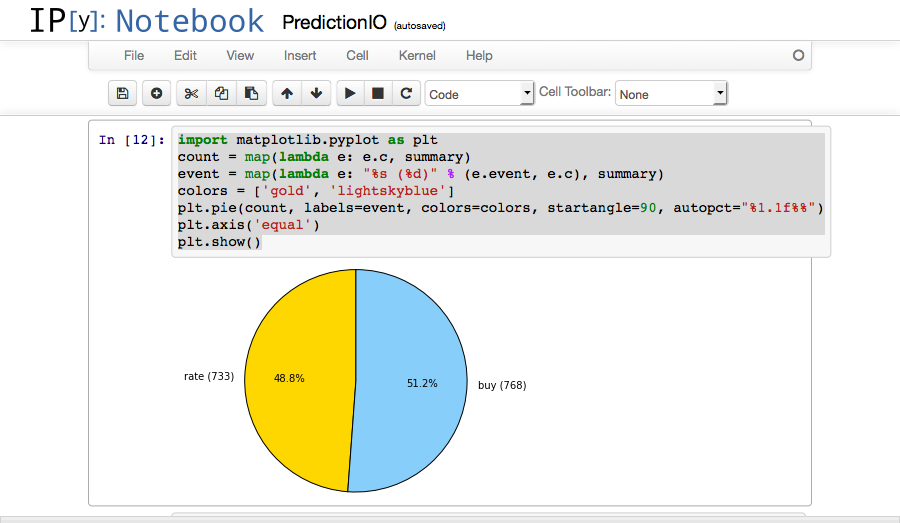
We can also plot our data, in the next two cells.
1 2 3 4 5 6 7 | import matplotlib.pyplot as plt count = map(lambda e: e.c, summary) event = map(lambda e: "%s (%d)" % (e.event, e.c), summary) colors = ['gold', 'lightskyblue'] plt.pie(count, labels=event, colors=colors, startangle=90, autopct="%1.1f%%") plt.axis('equal') plt.show() |
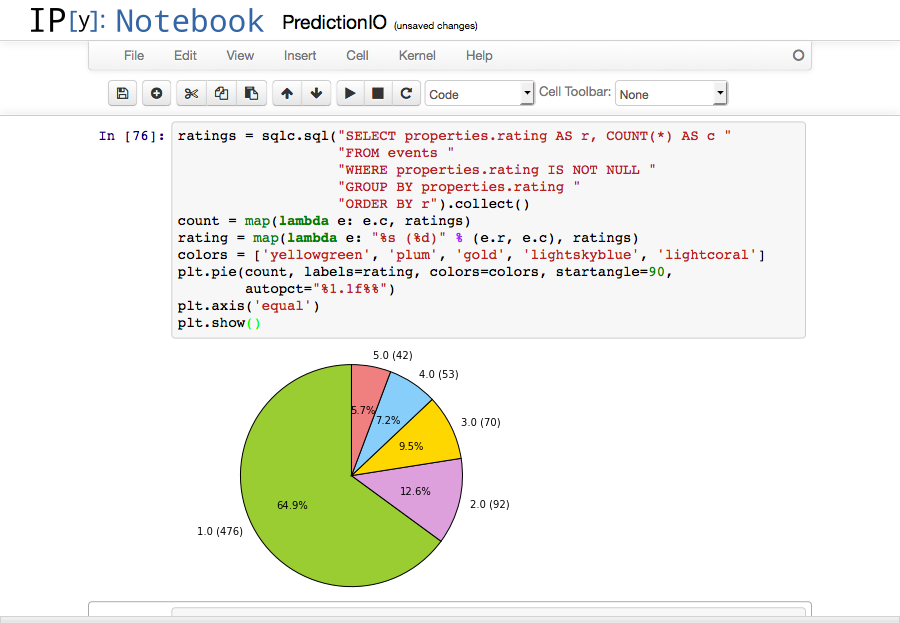
1 2 3 4 5 6 7 8 9 10 11 12 | ratings = sqlc.sql("SELECT properties.rating AS r, COUNT(*) AS c " "FROM events " "WHERE properties.rating IS NOT NULL " "GROUP BY properties.rating " "ORDER BY r").collect() count = map(lambda e: e.c, ratings) rating = map(lambda e: "%s (%d)" % (e.r, e.c), ratings) colors = ['yellowgreen', 'plum', 'gold', 'lightskyblue', 'lightcoral'] plt.pie(count, labels=rating, colors=colors, startangle=90, autopct="%1.1f%%") plt.axis('equal') plt.show() |
Happy analyzing!